What is the best way to measure the carbon emissions of a software application? What tools or methodologies should we use?
These are two questions I have been hearing a lot in the past months. And the discussion usually diverged into the accuracy of a given tool or methodology:
- How do you calculate the energy consumption of a Virtual Machine?
- What data do you use for the carbon intensity of the electricity powering the servers?
- Does the methodology account for Scope 3 emissions (generated during the manufacturing process of hardware, for example, servers, also known as embodied emissions)?
While all these are valid questions, they do not address the core of the problem. Why do we want to calculate these carbon emissions in the first place? Is it for yearly sustainability reporting purposes or to enable software engineers to reduce the environmental footprint of their applications?
From annual reporting to daily monitoring of carbon emissions
Traditionally, most organizations have been asking for these carbon emissions once a year so that they can include them in their annual sustainability reports. These reports commonly calculate the emissions on an aggregate level, for example, for all the software applications running in each data center. The drawback is that these findings are not actionable by software development teams.
As software engineers, we need to establish short feedback loops that inform us of the impact of our work on the carbon emitted by our software applications. By monitoring the carbon emissions of our software applications daily or hourly, we can identify any increase in carbon emissions (e.g., due to a new feature release) and promptly apply corrective actions to reduce these emissions.
Think of the analogy of following a diet to lose weight. Does it help to obsess over the accuracy of the weight scale? Any scale will do if you measure your weight frequently (e.g., weekly) and compare it with older values (measured by the same scale), adjusting your nutrition accordingly to lose weight. It’s the weight loss over time that matters, not the accuracy of a single measurement. If you only measure your weight once a year using a highly accurate weight scale, this will likely not help you lose weight.
The same thing applies to these highly accurate carbon accounting reports that many organizations compile once a year. Their findings are distant in time from the events (e.g., new software releases) that contributed to the reported carbon emissions, making it almost impossible to identify these events and more expensive to fix them.
How to monitor software carbon emissions
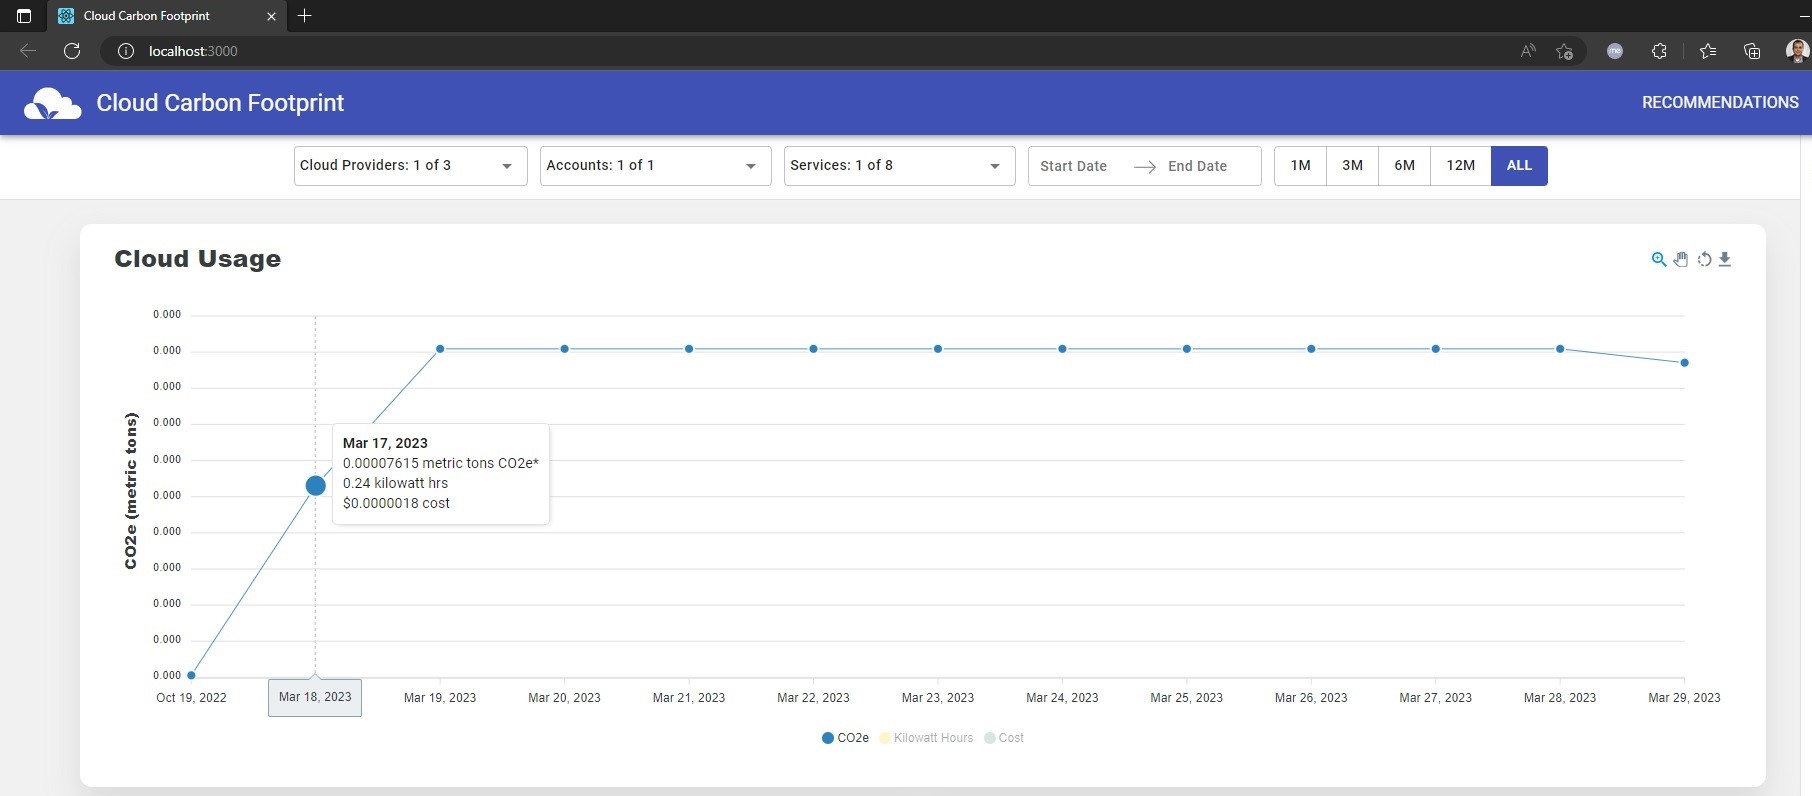
The open-source tool Cloud Carbon Footprint enables developers to monitor their application’s carbon emissions daily, allowing them to act if there is an unexpected increase in carbon emissions after deploying a change to production.

It retrieves the billing data from the hyperscalers (AWS, Azure, Google Cloud), which include details about the usage of the individual cloud services, and uses them to estimate the emitted carbon. In this process, it makes several assumptions, for example, using average constant values for the CPU utilization and the carbon intensity of the electricity powering the cloud data centers. Due to these assumptions, it can be less accurate than each cloud provider’s respective carbon footprint tools, such as Google Cloud Carbon Footprint, Azure Emissions Impact Dashboard, and AWS Customer Carbon Footprint Tool. These tools publish the carbon emissions for a given month with a delay of one month (Google Cloud and Azure) or three months (AWS) because they wait until all the data from the power grid operators becomes available regarding the carbon intensity of electricity.
Thus, the open-source tool Cloud Carbon Footprint is most suitable for development teams to monitor the carbon emissions of their applications daily. In contrast, the hyperscalers’ tools are best suited for including their more accurate emissions in the yearly sustainability reports.
| Tool | Cloud Carbon Footprint | Google Cloud Carbon Footprint | Azure Emissions Impact Dashboard | AWS Customer Carbon Footprint Tool |
|---|---|---|---|---|
| Data Granularity | Daily | Monthly | Monthly | Monthly |
| Data Availability | After one day | Up to 21 days after month end | After one month | After three months |
| Data Breakdown | By Day/Week/Month, Cloud Provider, Account, Cloud Service | By Month, Project, Cloud Service, Region | By Month, Subscription, Cloud Service, Region, Scope | By Month, Cloud Service (EC2, S3, Other), Geography (APAC, EMEA, AMER) |
| Supports | AWS, Azure, Google Cloud | Azure | AWS | |
| Suited for | Daily monitoring | Annual reporting | Annual reporting | Annual reporting (AWS excludes Scope 3 emissions) |
Identify carbon emission hotspots
One shortcoming of the tools above is that they aggregate the carbon emissions for all the resources under a cloud service, for example, aggregating the carbon emissions of all compute instances for a given cloud account. As a result, it can be challenging to identify which compute instance emits the most carbon. Likewise, when running containerized applications on Kubernetes, how could we find the pod or container emitting the most carbon?
New experimental open-source tools, like Kepler and Scaphandre, have emerged that address these challenges, allowing us to drill down to the carbon emissions of individual hosts, operating system processes, Kubernetes pods, and containers running on these hosts.
If you have a Kubernetes cluster, you can install Kepler (Kubernetes Efficient Power Level Exporter) to gain insights into the power consumption of Kubernetes pods and containers. Kepler collects various metrics from the CPUs, GPUs, and DRAMs of Kubernetes nodes and feeds these metrics into an ML model that estimates the power consumption per process, Kubernetes pod, and container.
For bare metal hosts and their hosted Qemu/KVM Virtual Machines, you can install a Scaphandre agent on each host. Scaphandre will collect CPU metrics and estimate the power consumption of every process running on the host.
Both tools export the estimated power consumptions as Prometheus metrics, enabling you to monitor the power consumption of your application processes on a dashboard like Grafana.
While these tools focus on power consumption, we can easily calculate the related carbon emissions as follows: Carbon emissions = Power consumption (kWh) x Grid carbon intensity (gCO2eq/kWh)
Especially when hosting your applications on-premises, you can use these tools to gain insights into your application’s power consumption hotspots and remediate them to reduce the consumption of your software, hence solving a critical concern nowadays for most data centers due to the increased energy prices.
As explained previously, the change over time in power consumption and carbon emissions matters, not the accuracy of a measurement at a point in time.
Track proxy sustainability metrics
Power consumption and carbon emissions are not the only metrics we can use to track the environmental impact of software applications.
We can monitor other metrics, such as CPU, memory, storage, and network usage, which correlate with a software application’s power consumption and carbon emissions. These are known as proxy metrics and can help us identify areas for improvement and track our progress in making our software greener.
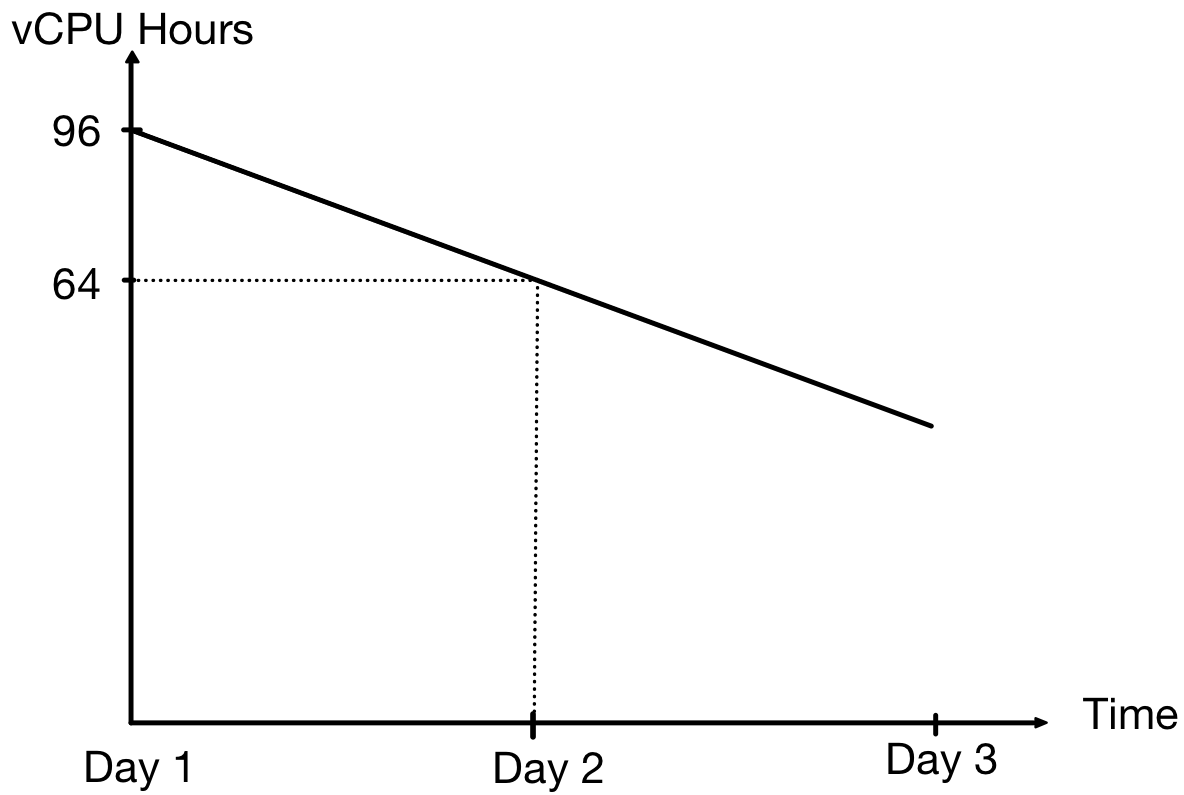
For example, think of measuring the proxy metric “vCPU hours = number of vCPUs x running instance hours” for a web application that runs all day on two Virtual Machines (VMs), with each VM having two vCPUs:
All day: 2 servers x (2 vCPUs per server) x 24 hours = 96 vCPU hours
Assuming most server traffic happens during office hours (09:00-17:00), we could scale in the web application in the evening (after 17:00) to run on a single server and scale out to two servers in the morning (before 09:00):
09:00-17:00: 2 servers x (2 vCPUs per server) x 8 hours = 32 vCPU hours
17:01-08:59: 1 server x (2 vCPUs per server) x 16 hours = 32 vCPU hours
Total / All day: 64 vCPU hours
In the first scenario, our application consumes 96 vCPU hours, whereas in the second scenario, it scales based on a schedule, hence consuming 64 vCPU hours.

We could monitor the “vCPUs hours” over time to track our progress in improving the efficiency of our software, aiming to get the same performance from fewer computing resources.
In the above example, we could improve the software efficiency by dynamically scaling out the server instances when the traffic exceeds a threshold instead of scaling them based on a schedule. The latter practice may result in running two compute instances for less than 8 hours daily, translating to less than 64 vCPU hours per day.
How will you monitor the greenness of your software?
Green software is an emerging field. One of the main challenges is the lack of mature methodologies and tools to monitor the carbon emissions of software applications. Despite these limitations, we can leverage the tools proposed in this article to establish short feedback loops in the development process that enable software practitioners to apply corrective actions.
What tools will you use to monitor the greenness of your software?
Further reading
- Did you find this article helpful? If yes, you may like reading my book on Green Software.
- An initiative from the Green Software Foundation to develop a “Real Time Energy and Carbon Standard for Cloud Providers: https://github.com/Green-Software-Foundation/real-time-cloud
- A blog from AWS on how to monitor proxy sustainability metrics: https://aws.amazon.com/blogs/aws-cloud-financial-management/measure-and-track-cloud-efficiency-with-sustainability-proxy-metrics-part-ii-establish-a-metrics-pipeline/

